Relevance
Newest
Oldest
Insights
-
Featured
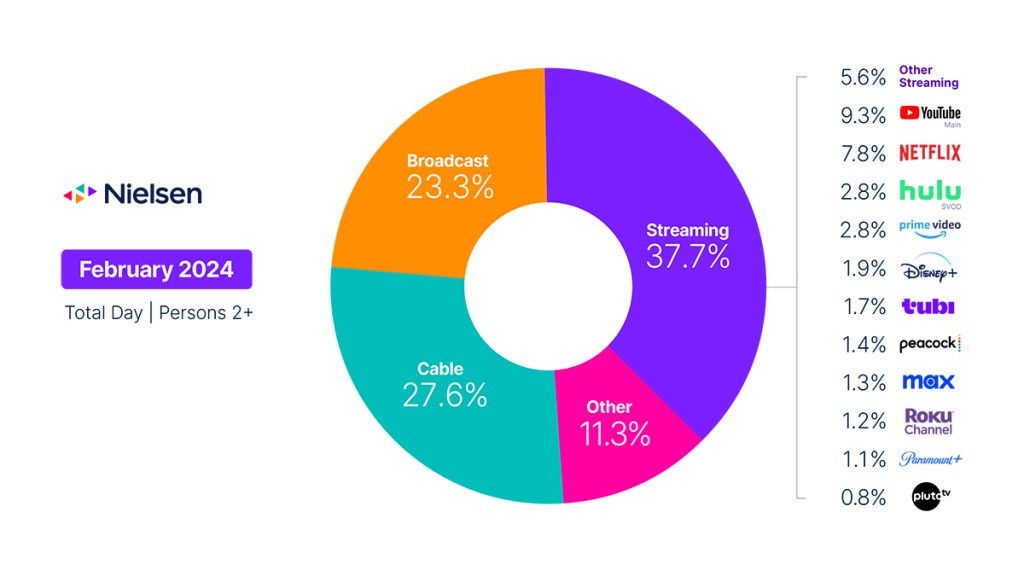
Super Sunday delivers a record day of TV viewing
While Super Bowl LVIII was a standout that attracted 123.7 million viewers, total TV usage declined in February in…
TV & streaming5m read
-
 Article
How marketers can advance personalized marketing across the digital advertising ecosystem
Quality audience data is the key to advancing personalized marketing initiatives across the digital advertising…
Advertising6m read
-
 Webinar
2024 Upfronts / NewFronts Webinar
Tune in for a conversation with Nielsen and the 4A’s on CTV insights and perspectives media planners should understand…
Advertising4m read
-
Article
Super Sunday delivers a record day of TV viewing
While Super Bowl LVIII was a standout that attracted 123.7 million viewers, total TV usage declined in February in…
TV & streaming5m read
-
Featured
How marketers can advance personalized marketing across the digital advertising ecosystem
Quality audience data is the key to advancing personalized marketing initiatives across the digital advertising…
Advertising6m read
Featured reports
-
 Report
Metadata matters: Powering future FAST channel success
This guide will help FAST channels prepare for the future, when search and discovery features within individual services…
TV & streaming1m read
-
 Report
The global Black audience: Shaping the future of media
Black America continues to diversify, and media will need to evolve to stay relevant for this media-hungry audience with…
Audiences5m read
-
 Report
The Upfronts/NewFronts Guide 2024
Discover the data and insights you need to navigate a shifting media landscape with Nielsen’s 2024-25 Upfronts/NewFronts…
Advertising18m read
