Relevance
Newest
Oldest
Insights
-
Featured
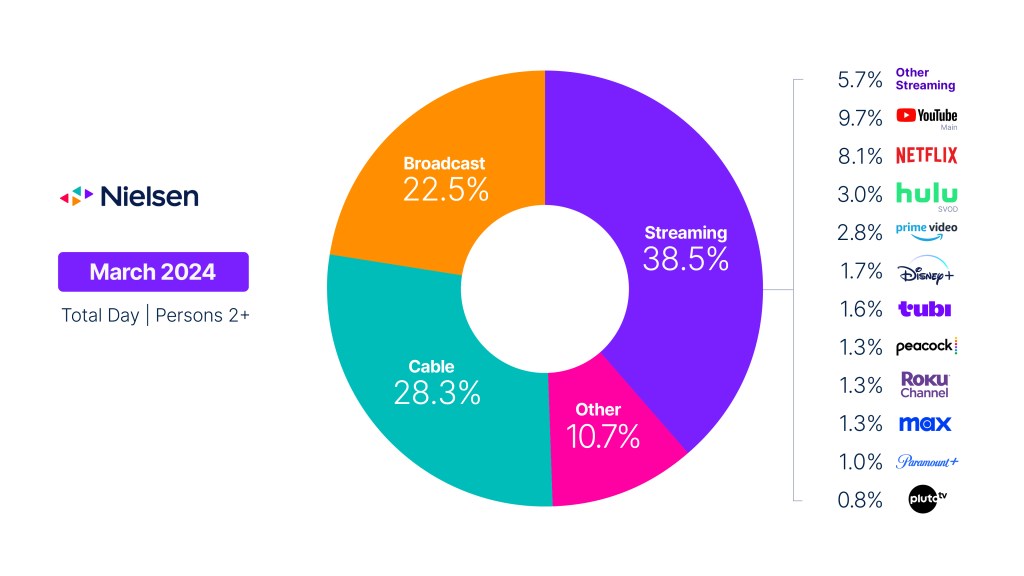
College basketball boosts U.S. cable viewing in March
Following seasonal viewing trends that typically begin in February, overall television usage in the U.S. dipped again in…
TV & streaming5m read
-
 Article
What’s TV these days?
Linear and streaming TV experiences are converging, and it could be a best case scenario for the entire media industry.
Advertising4m read
-
 Article
FAST has made linear TV cool again; personalization will make it cooler
Creators and publishers entering the FAST industry need to focus on metadata as they plan their distribution strategies.
TV & streaming5m read
-
 Report
Metadata matters: Powering future FAST channel success
This guide will help FAST channels prepare for the future, when search and discovery features within individual services…
TV & streaming1m read
-
Featured
What’s TV these days?
Linear and streaming TV experiences are converging, and it could be a best case scenario for the entire media industry.
Advertising4m read
Featured reports
-
Report
Metadata matters: Powering future FAST channel success
This guide will help FAST channels prepare for the future, when search and discovery features within individual services…
TV & streaming1m read
-
 Report
The global Black audience: Shaping the future of media
Black America continues to diversify, and media will need to evolve to stay relevant for this media-hungry audience with…
Audiences5m read
-
 Report
The Upfronts/NewFronts Guide 2024
Discover the data and insights you need to navigate a shifting media landscape with Nielsen’s 2024-25 Upfronts/NewFronts…
Advertising18m read
