For consumers, having content options is no longer a luxury, but an imperative. And so, too, are the multitude of devices that they use to engage with that content—be it a TV, tablet or soon-to-be emerging technologies.
But having a plethora of content options at our collective fingertips doesn’t necessarily mean consumers are connecting with ALL choices ALL of the time. In fact, according to the second quarter Nielsen Total Audience Report, which focuses on what options consumers have in addition to how they use them, behaviors and usage are unique to the device being used. Consumers still spend most of their time on traditional platforms, but they also look to explore the wide range of content channels made available by new media.
Adults still spend the most time watching TV, as the average adult spends more than four hours each day watching live TV. The average monthly channels available on TV (206) is only a fraction of what’s available on digital apps or websites, so consumers are using more of them. In the second quarter of 2016, consumers visited 55 PC sites and used 28 smartphone apps, compared to 20 TV channels viewed. Even though Americans have fewer channels to choose from than they did last year, the percentage of channels they actually view has remained consistent at 9.6% year over year from 2015-2016.
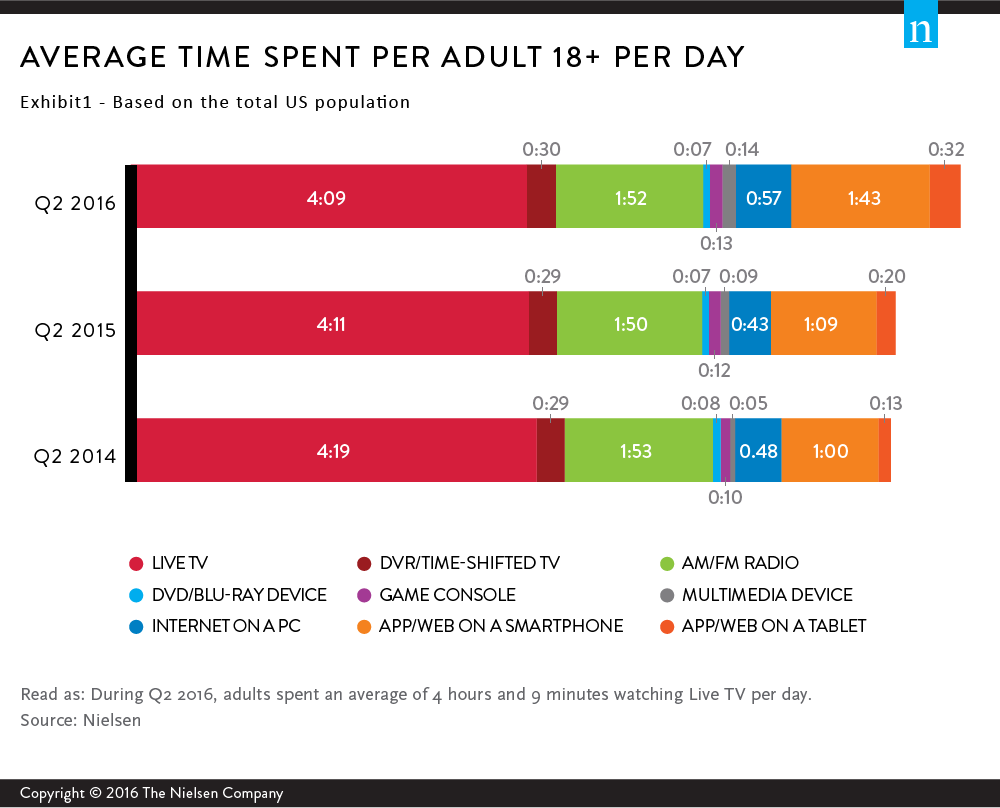
Americans spend nearly two hours listening to the radio each day, beating out smartphones, tablets and PCs for second place. With Spanish-language formats adding to their available options, Hispanics listen to the greatest number of radio stations.
Digital platform penetration continues to increase, prompting more accessible content for consumers to scroll, swipe and surf through.
Of all devices, PCs and smartphones boast the highest average monthly usage. On average, adults visit about 55 websites via PC, use 28 apps and visit 44 sites via smartphone, and use 14 apps via tablet. These digital platforms offer unbridled access to countless sites and apps available at the consumers’ fingertips, enabling them to frequent more types of content specific to their interests.
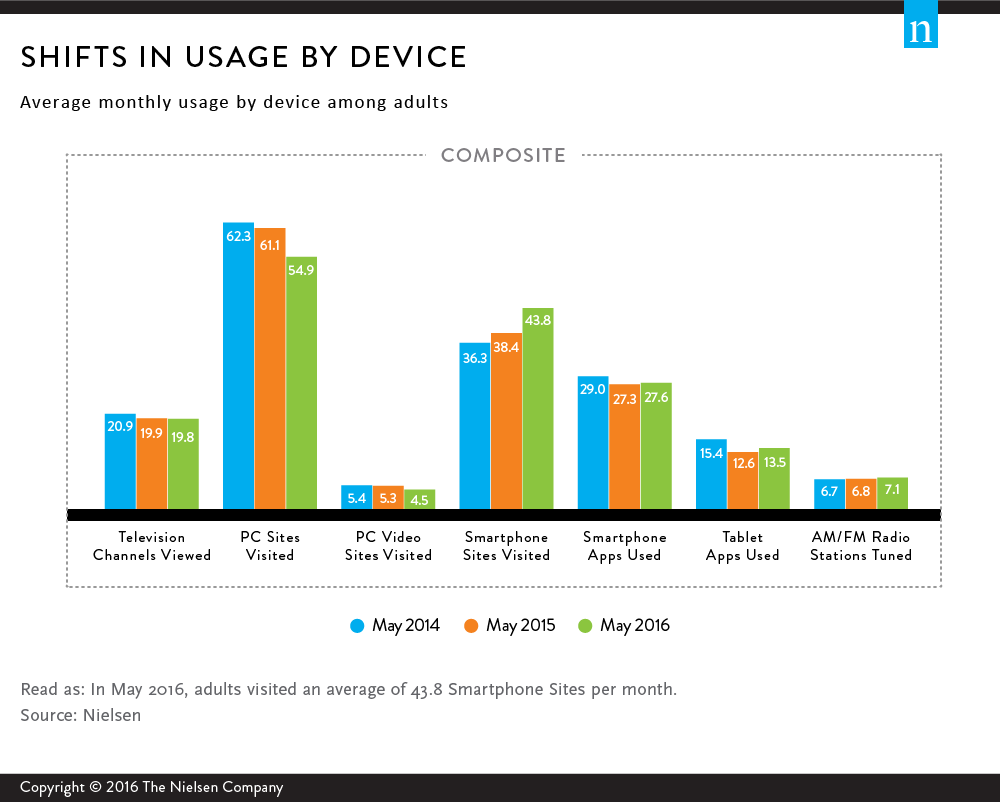
Site and app visitation, specifically on smartphones, continues to climb. We also see shifts in digital platforms: PC users are visiting fewer sites, while smartphones are showing an increase in sites visited. In fact, these are near mirrors of one another, with the average adult going to 7.4 fewer sites on the PC and 7.5 more sites on the smartphone over the past two years. Similarly, but to a lesser degree, consumers are also increasing the number of apps they visit on their smartphones (+1%) and tablets (+7%).
Black and Hispanic consumers visit more sites on their smartphones and use more apps than the national average. In fact, black adults also watch the greatest number of television channels, while Asian-Americans visit the most web and video sites via PC.
Although viewing levels for television have remained relatively flat from prior years, fragmentation of the media world hasn’t halted. Penetration of digital devices and subscription video on demand (SVOD) services continues to climb, providing consumers alternate sources of content.
But even though options like SVOD are gaining in popularity, consumers with access to a mixture of traditional and newer platforms tend to favor a combination of all options.
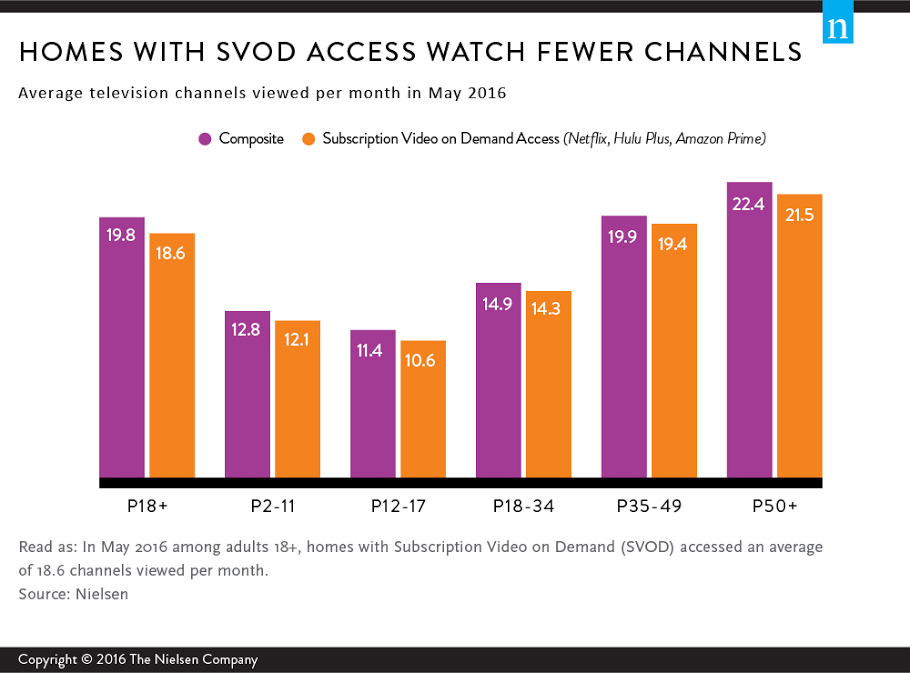
Across all demographics, TV homes with SVOD watch only one less channel than their respective national averages. In fact, consumers in homes with access to SVOD tend to be younger and have higher incomes, both of which watch less television, and consequently, access fewer channels. This includes the all-important 18-34 age group, which watches an average of 14.9 channels, compared with 14.3 channels in homes with SVOD access.
Consumers continue to desire and seek options when it comes to content. But in the expanding world of smart devices and the seemingly endless amount of sites and apps available, traditional means of media still hold their own.
For additional insights, download the second-quarter Nielsen Total Audience report.