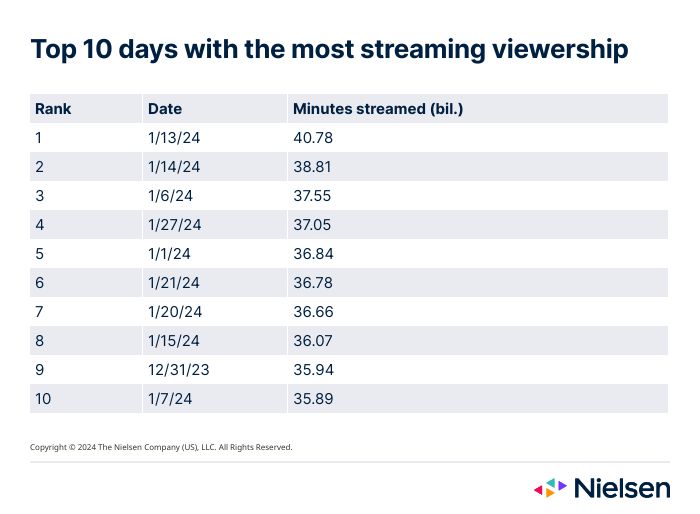
2024年1月13日、408億分の視聴時間を記録
肌寒い気候とNFLプレーオフの興奮が相まって、1月のテレビ総視聴率は3.7%上昇した。この月としては歴史的に特徴的なことではあるが、昨年を1.4%上回ったことがより注目される。実際、2024年1月は、ニールセンが2021年5月にThe Gauge 制作を開始して以来、テレビ視聴が最も多かった上位10日のうち3日が含まれている。
フットボールは常にテレビ視聴の大きな原動力であるが、タルサやポートランドなど季節的にそれほど涼しくない市場では、例年より寒い天候がテレビ視聴に一役買い、テレビ視聴はそれぞれ10%と7%増加した。タンパでは、気温の低さとバッカニアーズのプレーオフ進出が相まって、テレビ視聴が前年比14%増加した。
NFLのプレーオフのパワーはストリーミングにも波及し、Peacockで行われたワイルドカードのマイアミ・ドルフィンズ対カンザスシティ・チーフスの試合は約39億分の視聴(カンザスシティとマイアミのローカル視聴を含む)を記録し、2024年1月13日の1日のストリーミング量が過去最大となった。合計すると、2024年1月はニールセンが記録した過去最高のストリーミング量を記録した上位10日間のうち9日間を占め、2023年の大晦日(12月のインターバルで記録された)は9位に潜り込んだ。
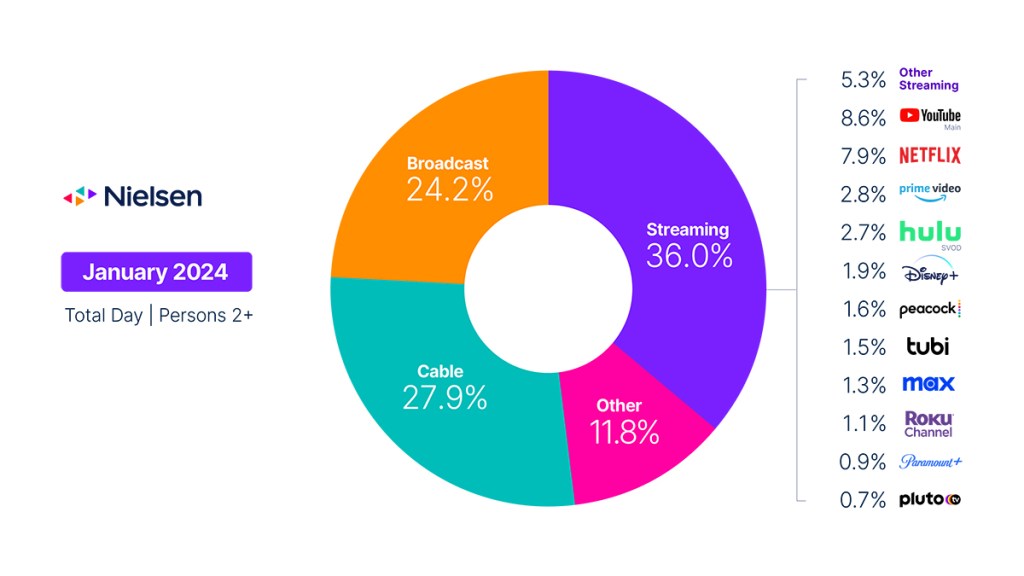
1月は寒さだけでなく、新番組のドラマが始まり、放送局の視聴率は20%上昇した。NBCの「シカゴ」シリーズ(「シカゴ・ファイア」、「シカゴ・メッド」、「 シカゴP.D.」)が牽引し、放送シーズン最初の「新」脚本コンテンツとなった。スポーツ視聴が36%増加したこともあり、放送局のTVシェアは0.7ポイント増加し、24.2%となった。しかし、新番組の登場がまだやや限られているため、放送の視聴は前年比20%減となった。
1月のケーブルテレビ視聴率は2.7%上昇したが、テレビ全体の視聴率が上昇したため、シェアは0.3ポイント低下し、27.9%となった。これは、視聴者がホリデーシーズンの映画から離れたためで、長編映画の視聴率は19%以上減少した。比較的、ニュース視聴は回復し、ケーブル利用全体の19%を占め、Fox News ChannelのIowa Town Hallは、スポーツ番組以外で唯一ケーブル放送のトップ10に入った(スポーツ解説を除く)。また、スポーツ番組はケーブルでは少なかったが、元旦のカレッジフットボールプレーオフのミシガン対アラバマ戦が2610万人の視聴者で首位になるなど、フットボールの試合が最も視聴された番組の上位を占めた。
Netflixの「フール・ミー・ワンス」は65億分で、最も視聴された番組のトップとなった。オリジナル作品がストリーミング・チャートのトップになったのは、2023年5月の「クイーン・シャーロット~ブリガートン・ストーリー」以来のことである。Disney+の「Bluey」が55億分、Amazon Prime Videoの「Reacher」が43億分と、僅差で続いた。合計すると、1月のストリーミング利用は4.1%増加した。
プラットフォーム別では、YouTubeが12ヶ月連続でストリーミングサービスの首位となった。ピーコックはNFLのプレーオフ中継が牽引し、利用が29%急増し、TVのシェアは過去最高の1.6%に達した。Netflixは0.2ポイント増加し、2023年8月以来最高となる7.9%のシェアを獲得した。
2月は、スーパーボウルの視聴率に加え、短縮された放送TVシーズンの正式なスタートとなるため、通常NFLシーズン終了後の視聴率低下をある程度相殺できる可能性がある。春はまだ先だが、従来のチャンネルやストリーミングチャンネルに新しいコンテンツが続々と登場することで、暖かい季節が来るまで視聴者は飽きずに視聴できるだろう。
ブライアン・フューラーと見る1月のデータ・トレンド
The Gaugeは、放送、ストリーミング、ケーブル、その他のソースを含む主要なテレビ配信プラットフォームにおける視聴者の視聴行動を毎月マクロ分析している。また、主要な個別ストリーミング配信事業者の内訳も含まれている。チャートそのものは、月次のテレビ総視聴率を、カテゴリー別および個々のストリーミング配信事業者別の視聴シェアに分けたものである。
方法論とよくある質問
The Gauge」はどのようにして作られるのか?
The Gauge データは、2つのパネルから別々に加重平均されたものであり、それを組み合わせてグラフを作成している。ニールセンのストリーミングデータは、全米TVパネル内のストリーミングメーター対応TV世帯のサブセットから得たもの。リニアTVソース(放送とケーブル)と総使用量は、ニールセンのTVパネル全体の視聴に基づいている。
データはすべて、各視聴ソースの期間に基づく。放送月を表すデータは、報告間隔のLive+7視聴に基づいている(注:Live+7には、テレビのライブ視聴に加え、リニアコンテンツの7日後までの視聴が含まれる)。
その他」には何が含まれるのか?
内 The Gaugeその他」には、放送、ケーブル、ストリーミングのカテゴリーに分類されないすべてのテレビ利用が含まれる。これには主に、その他のチューニング(未測定ソース)、未測定のビデオ・オン・デマンド(VOD)、オーディオストリーミング、ゲーム、その他のデバイス(DVD再生)の利用が含まれる。
2023年5月のインターバルから、ニールセンはストリーミング・コンテンツ視聴率を利用し、同サービスで報告されているプラットフォームが配信するオリジナルコンテンツを特定し、ケーブルのセットトップボックス経由で視聴されたコンテンツを再分類し始めた。この視聴は、ストリーミングとそれを配信したストリーミング・プラットフォームにクレジットされる。また、これまで反映されていたその他のカテゴリーからも削除される。ストリーミング・コンテンツ・レーティングの中でオリジナルと特定されていないコンテンツで、ケーブルセットトップボックスを通じて視聴されたものは、引き続きその他に含まれる。
その他のストリーミング」には何が含まれますか?
その他のストリーミング」として記載されているストリーミングプラットフォームには、個別に区分されていないテレビでの広帯域ビデオストリーミングが含まれる。ライブ放送やケーブル(リニア)番組を配信するために設計されたアプリ(Sling TVやCharter/SpectrumのようなvMVPDまたはMVPDアプリ)は、"その他のストリーミング "から除外される。
リニアストリーミングはどこに貢献するのか?
リニアストリーミング(vMVPD/MVPDアプリへの視聴の集計によって定義される)は、これらのアプリを通じて視聴される放送およびケーブルコンテンツがそれぞれのカテゴリにクレジットされるため、ストリーミングカテゴリから除外される。 この方法論的な変更は、2023年2月のインターバルから実施された。
ニールセンについて HuluやYouTubeでのライブストリーミングとは?
vMVPDアプリ経由のリニアストリーミング(例:Hulu Live、YouTube TV)はストリーミングカテゴリーから除外されている。ストリーミングカテゴリーの「Hulu SVOD」と「YouTube Main」は、リニアストリーミングを含まないプラットフォームの利用状況を指す。