
Pilots need real-time information to tell them how well their aircraft is performing and whether it’s on course to arrive on time or earlier, using airspeed indicators, altitude indicators, altimeters and more. The end goal is landing in their desired location. In-flight information is knowing and optimizing, while in flight, their means of getting there. Marketers, on the other hand, often don’t have the tools they need to understand in-flight performance and are forced to focus on the landing.
In a data-driven marketing era, leveraging in-flight indicators to optimize your campaign in near real time is key to achieving campaign results and a positive ROI. On-target audience metrics are a key in-flight indicator of performance. In fact, Nielsen recently conducted an analysis to validate that if you deliver the right ad to the right audience, you will improve your ROI, confirming that audience metrics are an early indicator of campaign performance. The validation follows basic marketing reasoning, given that advertisers and agencies have been preaching this sentiment for years.
Better reach = better outcomes
In our analysis, we conducted research across 15 brands and 82 campaigns and found that audience-based reach metrics are a clear and proven indicator of outcome metrics (ROI and effectiveness). We determined this by aligning in-flight reach metrics from Digital Ad Ratings (DAR) with outcome metrics from Nielsen Attribution.
Across those brands and campaigns we found a strong relationship (R-squared of 0.68) between audience-based reach metrics and sales outcomes. Said plainly, we found that 68% of the variance in outcomes across the 15 brands could be explained by the performance of a corresponding reach metric.
Take the blinded advertiser example in the chart. Each bubble represents data for one vendor, for one month, on one campaign. The X-axis displays the Tracked Ads Index, which is an index of the percentage of ads served to a target audience versus the population size.
The calculation for the Tracked Ads Index is as follows:
- If you serve 4% of your ads to an audience that is 4% of the population that equates to a 100 index, fair share.
- 2% of the ads would be undeserving this audience and a 50 index.
- 8% of the ads would be overserving and a 200 index.
ROI is on the Y-axis. The particular example is from an advertiser that saw results with various partners reaching its target audience.
The graph below shows three distinct performance groupings:
- The group in the bottom left represents partners who poorly reached their target audience.
- The group in the middle represents partners who were slightly better than random in reaching the target audience.
- The group in the top right represents partners who focused on reaching the target audience.
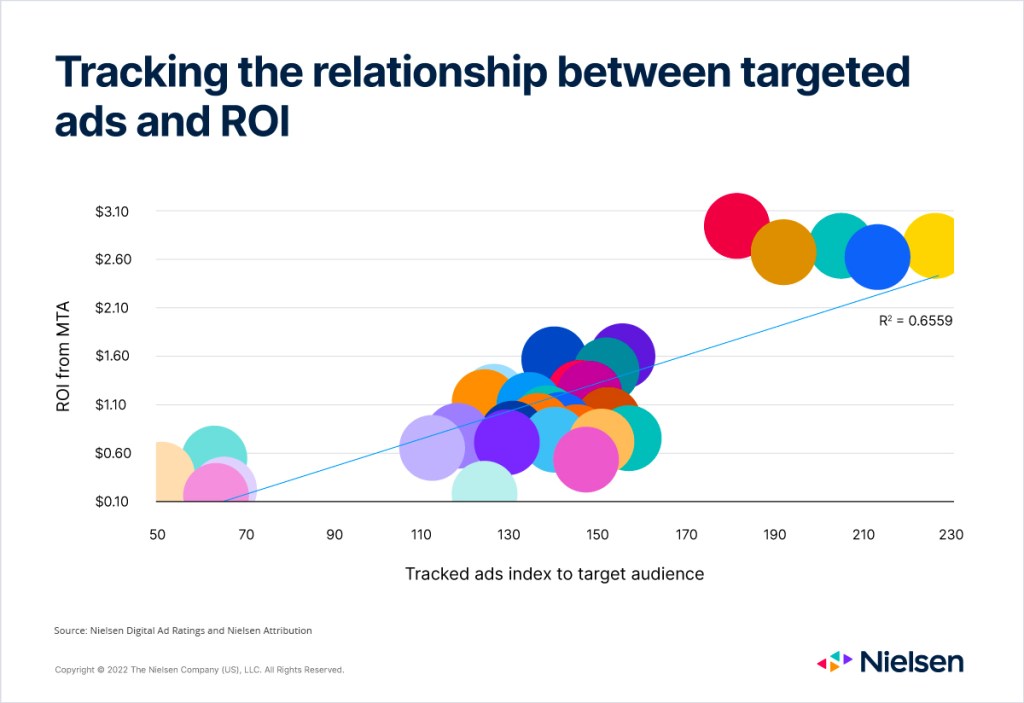
In this example, how did audience performance affect ROI? The cluster in the lower left (vendor/campaign/month data) represents an underdelivered audience, generating an average ROI of $0.25 for every $1 spend. The majority of the activity is in the middle of the chart, generating an average ROI of $1, but ROI did trend higher as the index increased. The cluster in the upper right represents the impact of delivering more ads to the targeted audience, which led to an increased ROI of $2.60 per $1 spent.
Knowing how you got there
So, what does this mean? Much as a pilot can use an altitude indicator to understand orientation with respect to the Earth’s horizon, marketers can use DAR metrics to indicate future outcomes performance. These metrics can also help marketers fine-tune their audiences, as was the case in this example. This particular advertiser previously used a variety of targets in the past, including a focus on much younger demographics. This analysis showed that focusing on the target audience while monitoring and optimizing performance in-flight leads to higher ROI for this brand.
It isn’t enough to simply know that you arrived at your destination, or that your campaign was successful. Marketers need to know how they got there and how to monitor their performance along the way with in-flight indicators if they plan to repeat and potentially improve their performance in the future.
This article originally appeared on adage.com.