When it comes to viewing media content, Filipinos still prefer television overall media platforms, however, growing connected device ownership and expanding social media engagement and interaction are fuelling demand for ‘always-on’ media.
Consistent with consumers in other Southeast Asian countries, video programming still generates its biggest audiences on television screens in the Philippines, with 75% of viewers in the country saying bigger is better when it comes to screen size. However, Filipinos also appreciate the convenience and portability of mobile devices. More than seven in 10 say that watching video programming on their mobile device is convenient. In addition, six in 10 say a tablet is just as good as a PC or laptop computer for watching programming, compared to just 53% globally.
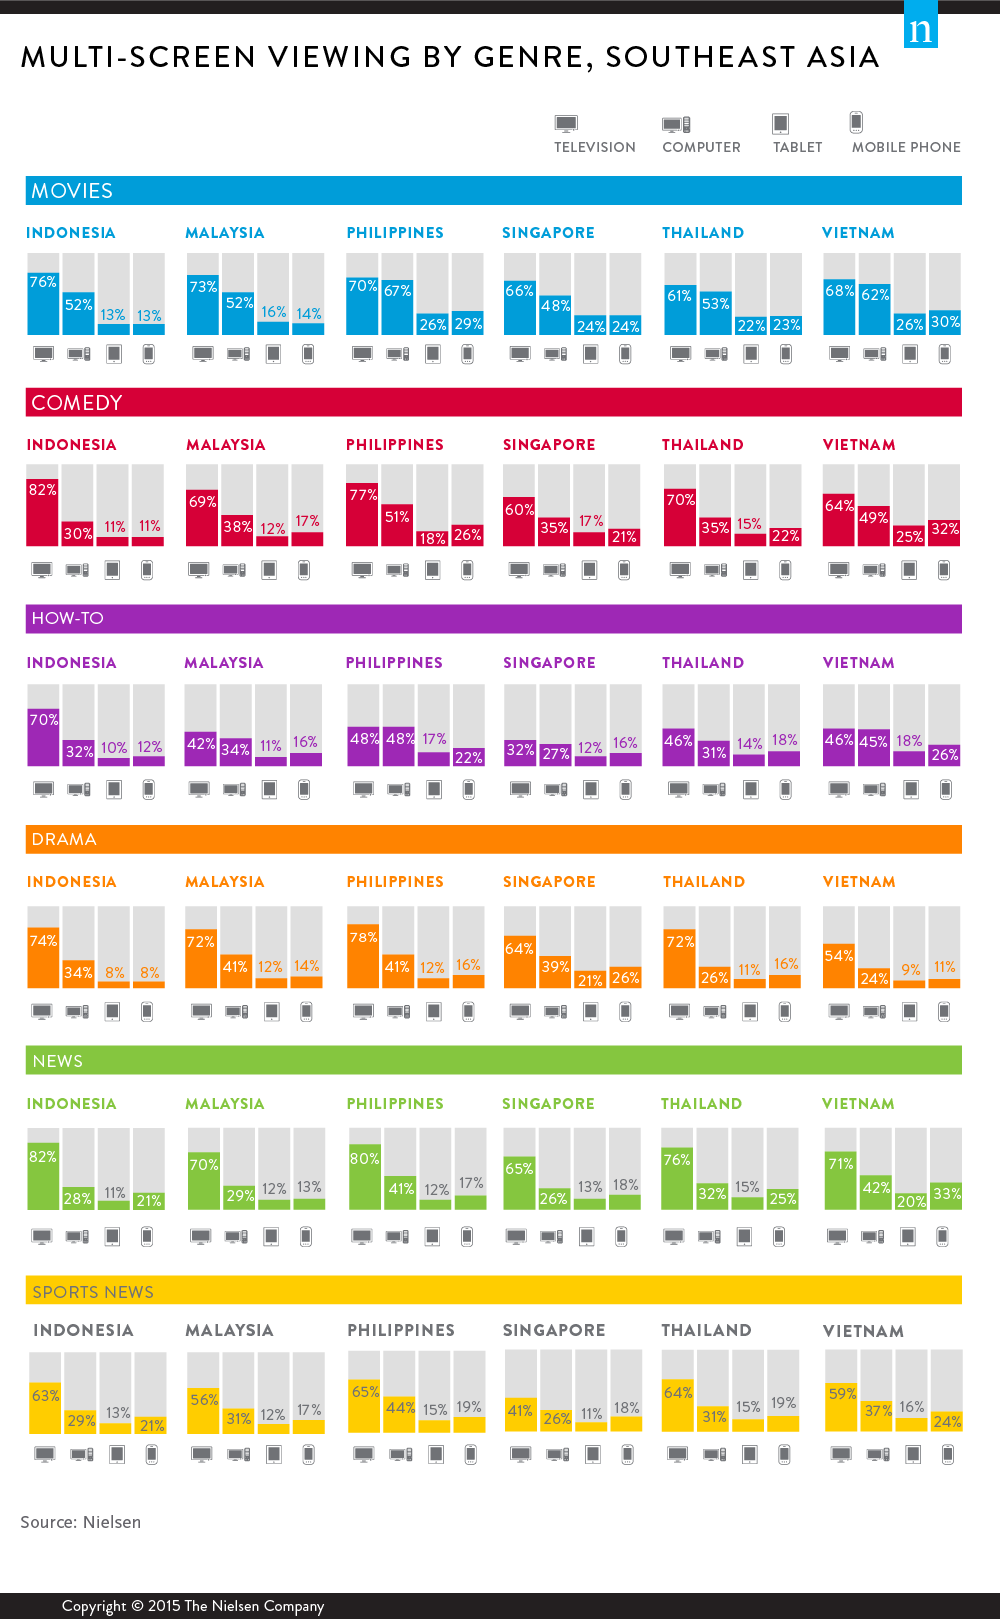
Particular genres and video formats such as movies, how-to shows, comedies, drama, news and sports are building a strong digital following. More than two thirds of Filipinos (67%) watch movies on a computer as do 62% of Vietnamese compared to 47% globally. A further 30% of Vietnamese, 29% of Filipinos, 24% of Singaporeans and 23% of Thais watch movies on a mobile phone compared to just 16% globally. Meanwhile the Philippines, Vietnam, Singapore and Thailand all rank in the top 10 countries globally when it comes to watching movies on a tablet, with around one quarter of viewership compared to 17% globally.
The Nielsen report highlights the growing affinity among Southeast Asian consumers for anywhere, anytime connectivity and keeping up to date with the latest news. Filipinos ranked highest globally in terms of the extent to which they enjoy the freedom of constant connectivity (94%), and Indonesians (89%) ranked second highest globally. Desire for ‘always-on’ connectivity was also high in Thailand (88%) and Vietnam (88%) which, respectively, ranked fifth and sixth globally, while 86% of Singaporeans and 84% of Malaysians enjoy the freedom of being connected anywhere anytime, compared to just 76% globally.
Live video programming holds strong appeal for consumers in the Philippines, Indonesia and Vietnam, particularly content which is linked to social media. More than three quarters of Indonesians (77%) said they prefer to watch video programming live (highest globally), followed by Filipinos and Vietnamese (76%). The Philippines along with Thailand, Vietnam, and Indonesia all rank in the top 10 countries globally when it comes to watching live video programming content more when it is tied to social media.
Time-shifted programming is also popular among Filipino consumers with 78% saying that watching time-shifted programming better accommodates their schedules, compared to 84% of Indonesians (84%), 74% of Vietnamese, 73% of Singaporeans and 71% of Malays and Thais, and 64% globally. A large proportion of Filipino viewers also access video content via catch-up TV, with many reporting to often watch several episodes on the same day.
As connected device ownership in the Philippines continues to expand, the prevalence of dual-screening in the country is also on the rise, registering the highest usage in the world. Globally, the Philippines ranks highest for browsing the Internet while watching video programming (76%), followed by Thailand and Vietnam (76%), and Indonesia (70%). Likewise, Filipinos are the most likely to engage others via social media while watching video programming (70%), followed by Thais (68%). Vietnamese and Indonesia are also avid users of social media during screen time – 62% and 59% respectively.
This article is based on insights contained in the Nielsen Global Digital Landscape Report. Click here now to access a complete copy of the report.