They say a rising tide lifts all ships, and that’s exactly what happened with TV viewing in November. With the four-day Thanksgiving weekend in play, Americans spent 7.8% more time with TV during the month than they did in October, watching almost 106 billion minutes of content on Thanksgiving alone.
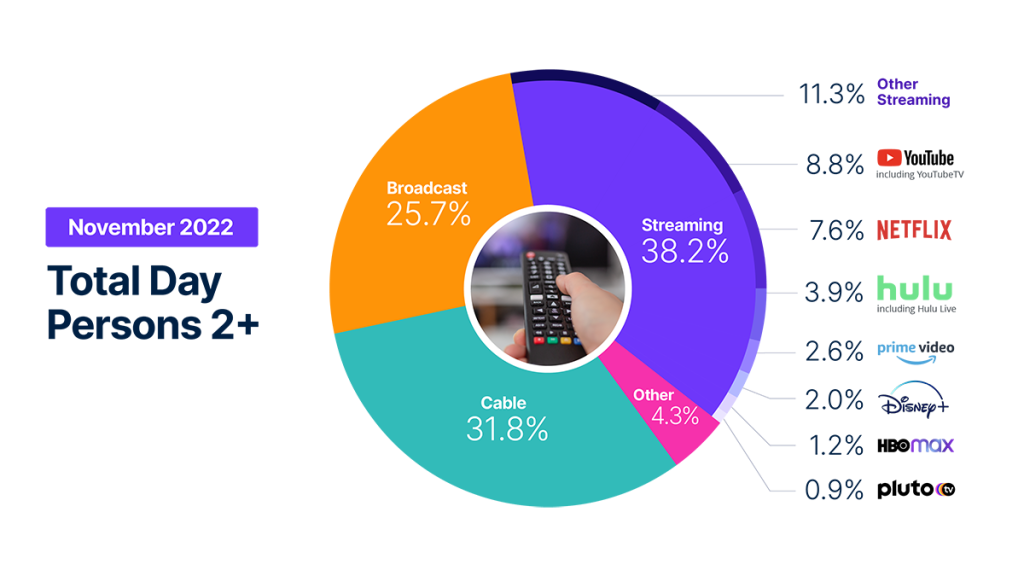
Total viewing aside, streaming continues to claim more of our TV time, breaking another record in November by earning 38.2% of total usage. And given audiences’ appetite for streaming content, viewing volume increased across virtually every measured service, with Netflix (+13.1%), HBO Max (+12.2%) and YouTube (+11.8%) leading the way. On a year-over-year basis, streaming usage is up more than 41%, and perhaps more importantly, there is no single route to viewership growth. For example, Netflix, HBO Max and YouTube, the top gainers in November, each gained viewing volume through different approaches—all to the benefit of the audiences.
- Netflix benefited from blockbuster original content, like Wednesday, Manifest and The Crown.
- HBO Max leaned on popular library content, including Friends, The Big Bang Theory and Game of Thrones.
- YouTube, including YouTube TV, benefited from contributions from creators, music and other sources and claimed 8.8% of TV in November.
Viewing of live TV via streaming apps (linear streaming) represented 5.8% of total TV in November (up from 5.7%) and 15.2% of all streaming.
While not as great as the 10.2% increase in streaming usage, broadcast’s usage gain of 6.7% in November helped its share of TV remain mostly stable, as it lost just 0.3 share points to land at 25.7%. A 10.2% surge in sports viewing, much of which was driven by the NFL, helped sports pull in 32% of all broadcast viewing. Meanwhile, news gained 14.6% more volume, while drama viewing was down 12.5%.
Cable viewing saw the smallest increase, gaining 4.2% from October, with feature film viewing up 32.7% to account for 18.7% of all cable viewing. News took the largest slice of cable viewing (18.9%), bolstered by interest in the midterm elections, while sports viewing volume was down 16% from October. On a year-over-year basis, however, cable sports viewing was up 19.6% given the start of the World Cup on Nov. 20, 2022.
Methodology and frequently asked questions
The Gauge provides a monthly macroanalysis of how consumers are accessing content across key television delivery platforms, including broadcast, streaming, cable and other sources. It also includes a breakdown of the major, individual streaming distributors. The chart itself shows the share by category and of total television usage by individual streaming distributors.
How is ‘The Gauge’ created?
The data for The Gauge is derived from two separately weighted panels and combined to create the graphic. Nielsen’s streaming data is derived from a subset of Streaming Meter-enabled TV households within the National TV panel. The linear TV sources (broadcast and cable), as well as total usage are based on viewing from Nielsen’s overall TV panel.
All the data is based on a time period for each viewing source. The data, representing a broadcast month, includes a combination of Live+7 viewing for the reporting interval (Note: Live+7 includes live television viewing plus viewing up to seven days later for linear content).
What is included in “Other”?
Within The Gauge, “other” includes all other TV. This primarily includes all other tuning (unmeasured sources), unmeasured video on demand (VOD), streaming through a cable set top box, gaming and other device (DVD playback) use. Because streaming via cable set top boxes does not credit respective streaming distributors, these are included in the “other” category. Crediting individual streaming distributors from cable set top boxes is something Nielsen continues to pursue as we enhance our Streaming Meter technology.
What is included in “other streaming”?
Streaming platforms listed as “other streaming” includes any high-bandwidth video streaming on television that is not individually broken out.
Where does linear streaming contribute?
Linear streaming (as defined by the aggregation of viewing to vMVPD/MVPD apps) are included in the streaming category and represented 5.8% of total television in November 2022. Broadcast and cable content viewed through these apps also credits to its respective category.
Do you include live streaming on Hulu and YouTube?
Yes, Hulu includes viewing on Hulu Live and YouTube includes viewing on YouTube TV.
Encoded Live TV, aka encoded linear streaming, is included in both the broadcast and cable groups (linear TV) as well as under streaming and other streaming e.g., Hulu Live, YouTube TV, Other Streaming MVPD/vMVPD apps. (Note: MVPD, or multichannel video programming distributor, is a service that provides multiple television channels. vMVPDs are distributors that aggregate linear (TV) content licensed from major programming networks and packaged together in a standalone subscription format and accessible on devices with a broadband connection.)